

 745 Reads
 23 mins


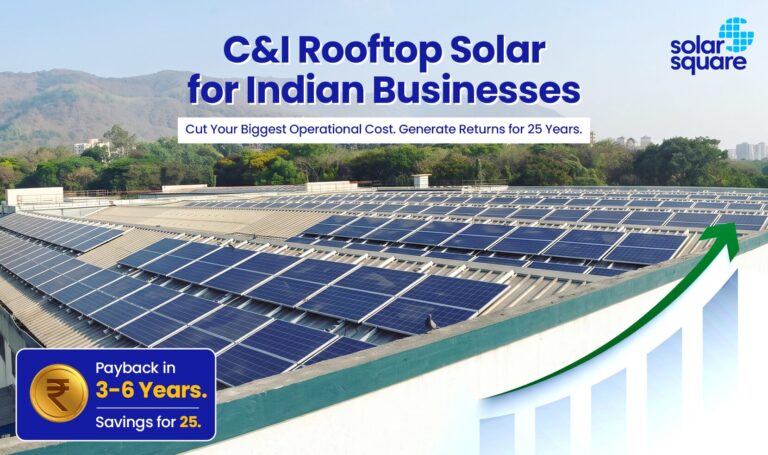
Electricity costs are not a line item most business owners look at with hope; they look at them with dread. And for good reason. For many energy-intensive businesses in India, including factories, hotels, hospitals and warehouses, electricity is a significant operating expense, often ranking among their highest recurring costs. The problem can compound over time as commercial and industrial electricity tariffs rise, with annual increases varying significantly across states and consumer categories.
This is precisely why C&I rooftop solar has shifted from being a sustainability initiative to a core financial strategy. Businesses that installed rooftop solar three or four years ago are now sitting on paid-off assets that generate electricity for effectively zero variable cost. The best part? When sized right, rooftop solar can cut up to 70% of electricity cost for C&I consumers.
In this guide, you’ll learn which businesses benefit the most from rooftop solar, what the C&I solar project cost is, and ROI calculations.
What Is C&I Rooftop Solar?
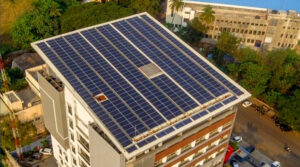
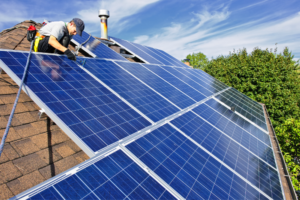
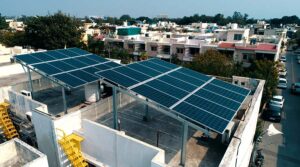
Commercial and Industrial rooftop solar refers to solar power systems installed on the rooftops of non-residential buildings, such as factories, warehouses, hotels, offices, hospitals, educational institutions, and shopping centres. These systems generate electricity during daylight hours, which the business consumes directly, reducing its dependence on DISCOM-supplied power.
Here’s an overview of the system size usually found in rooftop solar for businesses:
- Typical system capacities in the C&I segment range from 20 kW to 500 kW for commercial rooftop solar establishments such as office buildings, hotels, and retail stores.
- They can range from 100 kW up to 18 MW and beyond for large industrial facilities, manufacturing plants, and logistics parks.
The fundamental difference from a residential rooftop solar system is scale and purpose. A home solar system is designed to save up to 90% or near-zero on power bills for homeowners. A C&I system is designed to reduce a business’s single largest variable operating cost, at a scale where even a 30-40% reduction in power purchase costs can translate to significant EBITDA (Earnings Before Interest, Taxes, Depreciation, and Amortization) improvement.
Businesses That Benefit Most from Rooftop Solar
Solar for businesses is a smart choice, but not every business gets the same return from solar. The highest-return installations share a common characteristic: high daytime electricity consumption that aligns with peak solar generation hours, which is around 9 AM to 4 PM.
The industrial solar payback period remains consistent for manufacturing units and factories, particularly those running single or double day shifts. The following are some other businesses that benefit from rooftop solar:
- Warehouses
- Hotels and resorts
- Hospitals
- Shopping malls
- Educational institutions
- IT parks and office buildings
- Cold storage facilities
The following table highlights the types of businesses that are generally well-suited for rooftop solar, based on their typical electricity consumption and how well their operating hours align with solar generation. It can help businesses quickly assess whether their facility is likely to be a good candidate for C&I rooftop solar.
| Business Type | Typical Monthly Consumption (Units)* | Daytime Load Share (9 AM–4 PM)* |
| Manufacturing Factory (single/double shift) | 50,000-2,00,000+ | 70-85% |
| Hotel / Resort | 40,000-1,00,000 | 55-65% |
| Hospital | 60,000-1,50,000 | 60-70% |
| Warehouse / Cold Storage | 30,000-1,00,000 | 65-80% |
| Office Building / IT Park | 25,000-80,000 | 75-90% |
| School / College | 8,000-25,000 | 60-70% |
| Shopping Mall | 60,000-1,50,000 | 50-60% |
*Disclaimer: Figures are indicative estimates based on general industry patterns. Actual consumption, load profile, and payback period will vary based on the specific size, location, operating hours, and energy requirements of each building. A site-specific energy audit is recommended before finalizing system sizing or ROI projections.
How Much Does a C&I Solar Cost in India in 2026?
The first question every business owner asks is the right one: what will this actually cost? The answer in 2026 is more nuanced than a single number; costs have risen modestly from 2024-25 levels due to ALMM (Approved List of Models and Manufacturers) enforcement, global commodity movements, and improved quality standards, but remain highly competitive on an ROI basis.
C&I pricing among reputable installers in 2026 generally falls within the ₹30,000-₹50,000 per kW range for industrial and commercial systems.
*Disclaimer: Please note that prices are subject to change. The above-mentioned commercial solar installation cost is indicative and not fixed. The final commercial solar panel cost can vary based on the type of solar panels you use, the type of solar inverter you choose, the type of solar industrial system, whether or not you use a battery energy storage system, mounting structure height, type of after-sales service, roof height, etc.
System Cost Estimates by Capacity
C&I solar project costs in India generally fall between ~₹30,000 and ~₹50,000 per kW*, with the final price varying based on factors such as plant capacity, installation site, and project specifications.
The table below shows the estimated solar cost for factories and commercial plants across various system sizes.
| Size of Industrial Solar Energy Systems | Estimated Cost of Commercial Solar Power Plants in India in 2026* |
| 50 kW | ~₹15 lakh to ~₹25 lakh |
| 100 kW | ~₹30 lakh to ~₹50 lakh |
| 200 kW | ~₹60 lakh to ~₹1 crore |
| 300 kW | ~₹90 lakh to ~₹1.50 crore |
| 500 kW | ~₹1.50 crore to ~₹2.50 crore |
| 1 MW | ~₹3 crore to ~₹5 crore |
Disclaimer – Please note that prices are subject to change. The above-mentioned commercial solar installation cost is indicative, and not fixed. The final commercial solar panel cost can vary based on the type of solar panels you use (imported and DCR (Domestic Content Requirement) solar panels have a cost variation of ~15%), type of solar inverter you choose (string inverters and optimizers have a cost variation of ~10-15%), type of solar industrial system, whether or not you use a battery energy storage system (it increases the final cost by almost 30%), mounting structure height, type of after-sales service, roof height, etc.
Can C&I Solar Consumers Claim the PM Surya Ghar Muft Bijli Yojana Subsidy?
No. Commercial and industrial (C&I) consumers are not eligible for the PM Surya Ghar Muft Bijli Yojana subsidy. The scheme is meant for residential households only, so businesses such as factories, warehouses, hospitals, offices, and retail establishments cannot claim this subsidy for their rooftop solar systems.
However, solar financing can make rooftop solar more affordable for C&I consumers by reducing the upfront investment. Businesses can explore solar loans, CAPEX (Capital expenditures) financing, or OPEX (operating expense) /RESCO (Renewable Energy Service Company) models to spread the cost over time or avoid a large upfront payment altogether.
For businesses opting for CAPEX, the solar system is owned by the company, and eligible C&I consumers may also benefit from accelerated depreciation for tax purposes, subject to applicable tax rules.
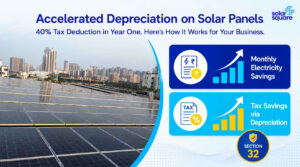
C&I businesses get a 40% Accelerated Depreciation benefit under Section 32 of the Income Tax Act, covered in detail below.
The right financing route depends on whether the business prioritises ownership and long-term savings or wants to minimise upfront investment. The main options include:
- CAPEX financing
- Solar loans
- OPEX/RESCO
Key Factors That Affect Your System Cost
The cost of a C&I rooftop solar system depends on its capacity, equipment, roof type, installation requirements, and applicable regulations. While larger systems generally have a higher total cost, the final price can vary significantly based on site conditions and component selection. A detailed site assessment is essential for an accurate project quotation.
Several factors influence the final rooftop system cost, such as:
- Solar panel technology: Mono PERC and TOPCon panels offer higher efficiency than standard polycrystalline panels, but they also cost more. For large rooftops, this higher efficiency means the same output can be generated using less space, which is useful when roof area is limited.
- Inverter type: String inverters are cost-effective for large, shadow-free industrial rooftops. Microinverters or DC optimisers add cost but improve generation from partially shaded or complex rooftops.
- Roof structure and condition: It can add substantially to project cost. An RCC (Reinforced Cement Concrete) flat roof is the most installation-friendly; metal sheet or tiled roofs require different mounting structures. If a roof requires structural reinforcement before solar installation, that cost falls outside the solar system quote.
- Net metering requirements: Net metering requirements and state-level regulatory complexity vary. States like Gujarat and Maharashtra have well-established C&I net metering frameworks; others may involve longer approval timelines and additional compliance costs.
Why Are Indian Businesses Investing in C&I Rooftop Solar?
Businesses across India are increasingly turning to C&I rooftop solar to reduce their dependence on grid electricity and bring down a major recurring operating expense. With rising tariffs, high daytime power consumption, and the falling cost of solar technology, generating electricity on-site can offer a compelling way to control long-term energy costs.
Rising Commercial and Industrial Electricity Tariffs
Commercial and industrial consumers pay significantly more per unit of electricity than residential customers; in most states, between ₹6 and ₹15 per unit, depending on the demand slab and time-of-day charges. These tariffs have been rising consistently. Given India’s infrastructure investment cycle and cross-subsidy obligations, commercial tariff increases are structural, not cyclical.
#1. Long-Term, Predictable Cost Savings
A properly designed C&I solar system can meet 70% of a business’s daytime electricity requirement. Once the system is paid off, typically in 3 to 4 years, the electricity it generates is essentially free, accounting only for modest operations and maintenance expenses. This creates a structural cost advantage that compounds over the 25-year system lifespan.
#2. Sustainability, ESG (Environmental, Social, and Governance), and Regulatory Compliance
Large commercial and industrial consumers in India are subject to Renewable Purchase Obligations (RPO), mandatory targets for sourcing a minimum percentage of energy from renewable sources. Rooftop solar for businesses directly fulfills RPO requirements, helping businesses avoid compliance penalties.
Beyond compliance, ESG considerations are increasingly driving procurement decisions. Global supply chains, institutional investors, and export market buyers now scrutinise the carbon footprint of their suppliers. A solar-powered facility is a verifiable, auditable sustainability credential that strengthens both regulatory standing and business relationships.
How Much Electricity Will a C&I Solar System Generate?
A C&I rooftop solar system typically generates around 1,200-1,400 units (kWh) per kW of installed capacity per year, depending on factors such as location, sunlight, system design, equipment, and operating conditions. For example, a 100 kW system may generate roughly 1.2-1.4 lakh units annually under suitable conditions. These are indicative figures, not guaranteed generation levels.
Generation is the other side of the ROI equation. The more electricity a system generates and the more of that electricity a business can effectively use, the greater its potential to reduce grid electricity costs.
Let’s begin by understanding how to calculate solar generation using a simple formula.
The Solar Generation Formula
Annual generation = System Capacity (kW) × Average Peak Sun Hours per Day × Performance Ratio × 365
For many locations in central and peninsular India, solar irradiation is typically strong enough to support around 4.5-5.5 peak-sun-hours of equivalent generation per day, although the actual figure varies by location and season. A performance ratio of around 0.75-0.80 is a reasonable planning assumption for a well-designed and maintained C&I solar system, but actual performance depends on factors such as temperature, soiling, shading, equipment losses and system availability.
In practical terms, 1 kW of installed capacity generates approximately 1,200 to 1,400 units per year across most of India, with higher generation in Rajasthan, Gujarat, and South India where solar irradiance is strongest.
Estimated Annual Generation by System Size
Solar generation increases with system size, but the exact output depends on local sunlight, system design, rooftop conditions, and operating performance. The table below provides indicative annual generation ranges for common C&I rooftop solar system sizes.
| System Size | Estimated Annual Generation* |
| 50 kW | ~60,000-70,000 units |
| 100 kW | ~1.2-1.4 lakh units |
| 250 kW | ~3-3.5 lakh units |
| 500 kW | ~6-7 lakh units |
| 1 MW | ~12-14 lakh units |
*Disclaimer: The solar power generation figures shown are indicative estimates only, based on broad assumptions about typical solar irradiation, system design, equipment performance, and normal operating conditions. They are not guaranteed generation figures or project-specific estimates. Actual generation can vary significantly with location, weather, shading, rooftop orientation, equipment, system losses, soiling, maintenance, degradation, and downtime. These figures should not be used to promise or calculate specific savings, project costs, ROI, or payback. Actual performance and financial returns should be assessed through a site-specific technical and financial evaluation.
Factors That Affect How Much Your System Actually Generates
The actual energy output of a solar system depends on several factors beyond its installed capacity. Location, sunlight, system design, shading, equipment, and maintenance can all affect how much electricity your system generates.
- Location: A 100 kW rooftop solar system in Jodhpur will outperform the same system in Shillong by 25-30%.
- Roof orientation: South-facing panels at the optimal tilt angle generate 10-15% more than east- or west-facing panels.
- Shadow-free rooftop area: Even small shadows from water tanks, AC units, or parapet walls can reduce generation disproportionately if not accounted for in system design.
- Regular maintenance: Solar panel cleaning ensures the system performs close to its rated capacity throughout its life.
How Is ROI Calculated for a C&I Solar Project?
Unlike many business investments, solar generates a measurable, monthly cash flow benefit from day one. ROI is relatively straightforward to model, which is part of what makes solar attractive to finance teams.
Let’s learn how to calculate ROI from a C&I project in detail.
The Basic ROI Formula
ROI (%) = (Annual Savings ÷ Net Project Cost) × 100
Where “Net Project Cost” accounts for tax savings from Accelerated Depreciation in the first year, which substantially reduces the effective capital outlay.
Components of Solar ROI for a Business
A business’s return on investment from rooftop solar comes from more than just lower electricity bills. The overall ROI can be influenced by the value of solar generation, credits from surplus power, and applicable tax benefits. Understanding these components helps businesses evaluate the true financial impact of a solar investment –
- Electricity savings: The value of units generated by the rooftop solar system that the business would otherwise have purchased from the DISCOM at commercial tariff rates of ₹6-₹15/unit depending on the state and slab.
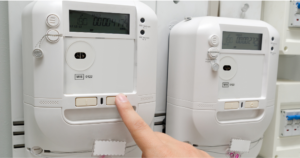
- Net metering benefits: When a grid-connected rooftop solar system generates more electricity than the business consumes in a given period, the surplus is exported to the grid and credited against future bills. For businesses with weekend shutdowns or seasonal variations, net metering ensures no generation goes to waste.
- Accelerated Depreciation tax benefit: It is a powerful accelerator of effective ROI that many businesses underestimate. Under Section 32 of the Income Tax Act, businesses can claim 40% depreciation on a solar project in the first year, nearly three times the standard rate of 15% for general plant and machinery. An additional 20% may be available only to businesses that meet the specific conditions under Section 32(1)(iia), such as certain manufacturing or power-sector businesses. It is not a standard benefit for all C&I solar projects.
- C&I consumers with maximum demand above 10 kW: ToD (time of the day) tariffs allow businesses to reduce electricity costs by shifting consumption away from peak hours. For businesses with significant peak-hour demand, managing when power is drawn from the grid can reduce the demand and energy charges applicable under their state tariff.
- Energy security and production continuity: Businesses in areas with frequent grid outages or voltage fluctuations gain a more reliable power source, reducing production downtime.
ROI for a 100 kW Commercial Solar System
The following example shows how the economics of a 100 kW commercial solar system can look under the stated assumptions. It combines annual electricity savings with the first-year Accelerated Depreciation (AD) tax benefit to illustrate the potential ROI and simple payback period. Actual returns will vary based on tariff, generation, project cost, and tax position.
| Parameter | Value* |
| System Capacity | 100 kW |
| Total Project Cost | ~₹36 Lakhs |
| Annual Generation | ~1.2-1.4 Lakh Units |
| Average Commercial Tariff | ~₹9/unit |
| Annual Electricity Savings | ~₹10.8-12.6 Lakhs |
| AD Tax Benefit (Year 1, 25% tax rate) | ~₹3.6 Lakhs |
| Effective Year-1 ROI | ~40-42% |
| Simple Payback Period | 2.9-3.3 Years |
Once the ~3-3.3 year payback period is complete, the business continues generating ~₹ 10.8-12.6 lakh in annual electricity savings for the remaining 20+ years of the system’s life, with only modest O&M costs (typically ~0.5-1% of project cost annually for cleaning, monitoring, and inverter upkeep).
*Disclaimer: The figures above are illustrative estimates based on the stated assumptions and should not be treated as guaranteed returns. Actual project cost, generation, electricity savings, AD tax benefit, ROI, and payback period can vary depending on type of roof (RCC or tin sheds), inverter technology, number of buildings, location, tariff, system design, financing, taxes, and system performance.
What Is the Payback Period for C&I Rooftop Solar?
The industrial solar payback period is the time required for cumulative electricity savings to equal the initial project investment. For C&I businesses, this is one of the most compelling benefits: rooftop solar can be a highly attractive investment, with breakeven often achieved in 3-4 years while savings can continue over the system’s 25-year project life.
Typical Payback Periods by Business Type (2026)
Payback periods vary across business types based on electricity consumption, tariffs, operating hours, and solar system size. The table below gives typical C&I rooftop solar payback ranges for different types of businesses in 2026.
| Business Type | Typical Payback Period |
| Factory / Manufacturing Unit | 3-4 Years |
| Hotel / Resort | 3-5 Years |
| Hospital | 4-5 Years |
| Warehouse / Cold Storage | 3-4 Years |
| Commercial Building / IT Park | 4-6 Years |
| Educational Institution | 4-6 Years |
Factors That Reduce Payback Time
C&I solar payback depends on how quickly the system recovers its initial cost through electricity savings and tax benefits. Higher electricity tariffs, Accelerated Depreciation, and better rooftop utilization can all shorten the payback period. Businesses can improve returns by optimizing system design, maximizing generation, and making full use of available financial benefits.
The following are the factors that will reduce the payback time for C&I rooftop solar:
- Higher commercial electricity tariffs: A business paying ~₹ 12/unit saves twice as much per unit as one paying ~₹ 6/unit from the same solar system. Businesses in states with high commercial tariffs (Maharashtra, Tamil Nadu, Karnataka) typically see the fastest paybacks.
- Accelerated depreciation: This effectively reduces the net C&I solar project cost in the first year, compressing payback by 6-12 months for profitable businesses with sufficient taxable income.
- Better rooftop utilization: Maximizing the installed capacity relative to available shadow-free area improves total generation and therefore total savings. A well-designed system can install more capacity within the same available space. For example, it may fit 200 kW instead of 150 kW. This means the business can generate more solar power while spreading fixed costs, such as structural work and approvals, across a larger system.
- High daytime energy consumption alignment: A factory that runs all machinery from 8 AM to 6 PM consumes almost all its solar generation directly, at full commercial tariff value. An office that uses less power during the day may export more solar energy to the grid. Lower credits for exported power can increase the payback period.
Commercial Solar Financing Options
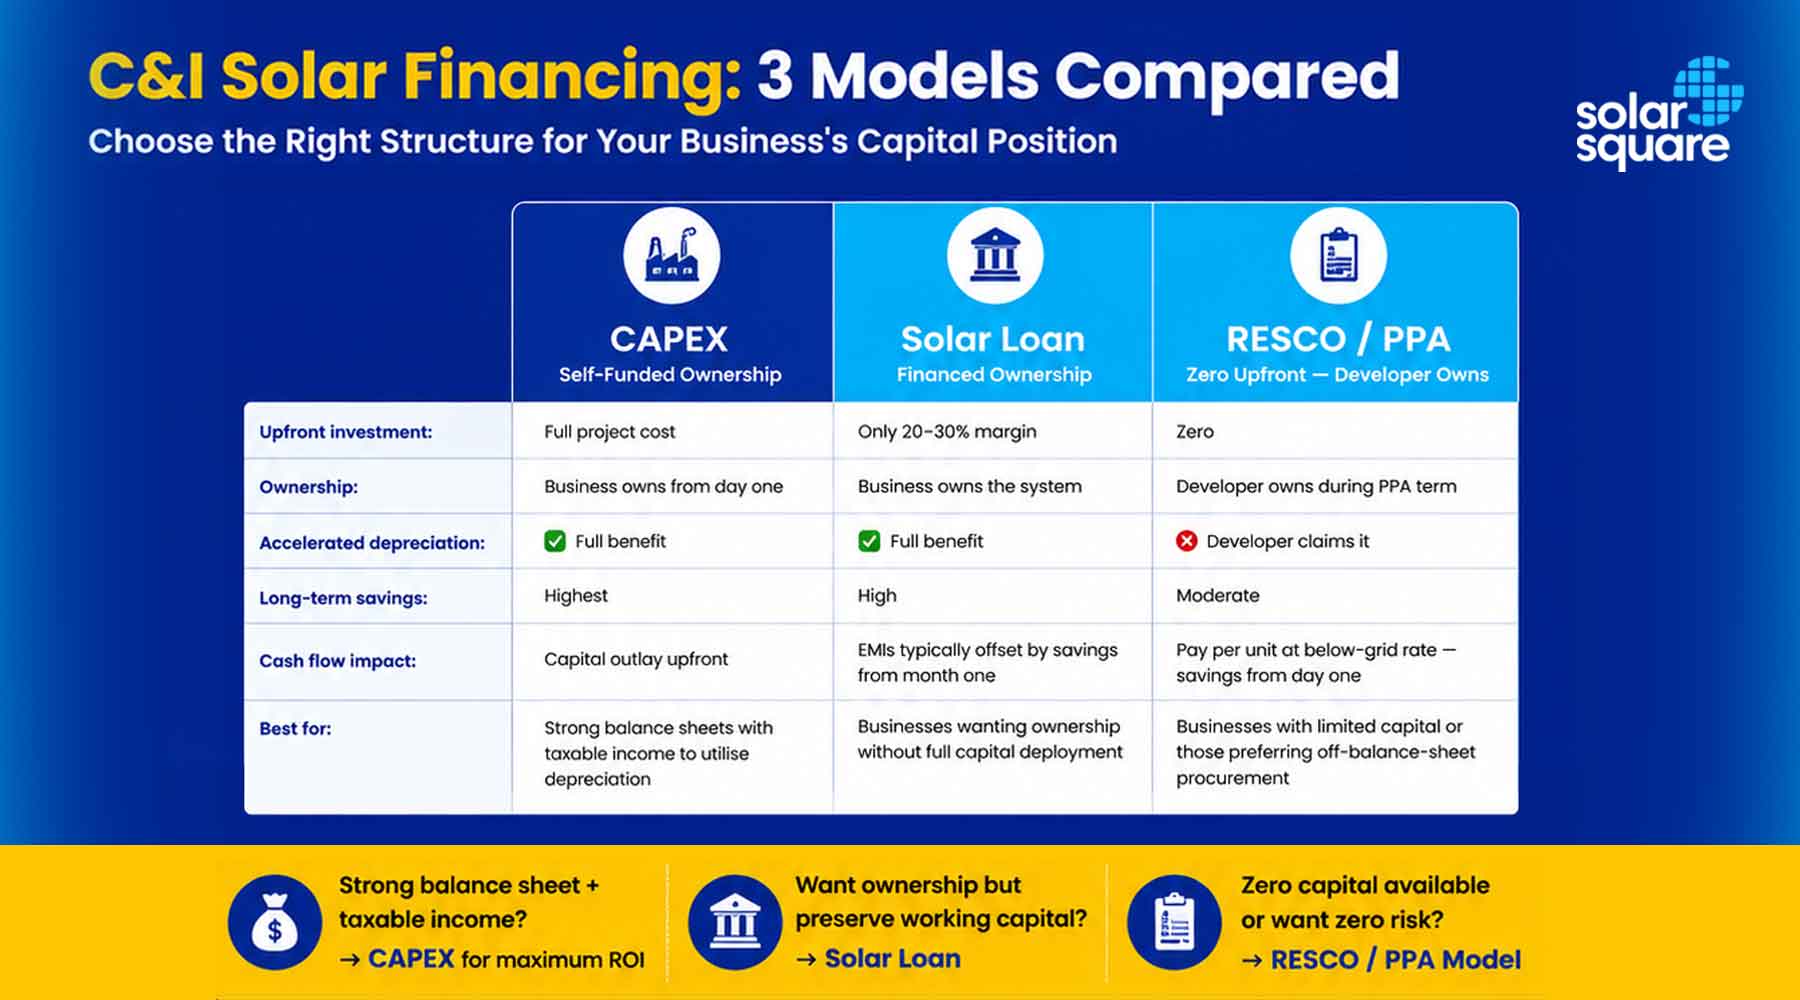
Capital outlay is often the primary barrier to C&I solar adoption, particularly for mid-sized businesses where ₹50 lakh to ₹1 crore represents a meaningful deployment of working capital. The good news: there are now multiple solar power financing models that make business solar savings accessible regardless of where your business sits on the capital availability spectrum. Businesses can choose from three main approaches: CAPEX, solar loans, and RESCO (Renewable Energy Service Company) / PPA (Power Purchase Agreement) models. Here’s how each financing option works and who it is best suited for:
- CAPEX – Self-Funded Ownership: The business funds the entire installation from its own capital or reserves. The business owns the system from day one, receives all electricity savings, and claims the full Accelerated Depreciation benefit against taxable income. This model delivers the highest long-term ROI and the fastest effective payback when you include the AD benefit. It is best suited for businesses with strong balance sheets and sufficient taxable income to utilise the depreciation fully.
- Solar Loans – Financed Ownership: Banks, NBFCs (Non-Banking Financial Companies), and green energy lenders offer project financing for C&I solar installations, typically covering 70-80% of the project cost. The business pays the remaining 20-30% as a margin.
The business retains ownership and the AD benefit. Interest on the solar loan is deductible as a business expense. Typical loan tenures run 5 to 7 years at rates ranging from 14% to 16% per annum depending on the lender and the borrower’s credit profile. - RESCO / PPA Model – Zero Upfront Investment: Under the RESCO (Renewable Energy Service Company) model, a third-party developer finances, installs, owns, and operates the solar system on the business’s premises. The business pays nothing upfront; instead, it purchases the solar electricity generated at a pre-agreed tariff rate based on the PPA agreement, typically ~₹6 to ~₹10 per kWh, compared to the ₹6-₹15/unit it currently pays the DISCOM.
RESCO/PPA is most suitable for businesses with limited capital availability, those that prefer off-balance-sheet energy procurement, or businesses in the early stages of evaluating solar before committing to ownership.
You can also check out the detailed comparison between CAPEX and RESCO models in our blog on RESCO vs CAPEX.
Financing Model Comparison
Choosing the right financing model can significantly affect the upfront investment, ownership, and long-term savings from a C&I solar system. The table below compares the three common options, CAPEX, solar loans, and RESCO/PPA, across these key factors to help businesses identify the model that best fits their financial goals.
| Financing Model | Upfront Cost | System Ownership | AD Benefit | Long-Term Savings |
| CAPEX | High | Business | Full | Highest |
| Solar Loan | Low-Medium | Business | Full | High |
| RESCO / PPA | Zero | Developer | None | Moderate |
Common Challenges in C&I Solar Projects
The following are some of the most common challenges faced in C&I solar projects, which can be easily fixed when you choose the right solar company:
- Roof space and shadow constraints: Large rooftop solar systems require a substantial shadow-free rooftop area. The standard rule of thumb is approximately 100 sq. ft. (10 sq. m.) per kW of installed capacity. A 500 kW system therefore requires around 50,000 sq. ft. of usable rooftop. Water tanks, AC units, vents, and parapets can all create shading that reduces generation. A detailed shadow analysis using simulation software is essential before system sizing.
- Structural load assessment: Solar panels, mounting structures, and associated wiring add a dead load of approximately 30 kg/m² to the roof. Older industrial buildings or warehouses may not have been designed to carry this additional load. A structural audit before installation is not optional; it is a safety and insurance requirement, and it can add to project cost and timeline if remediation is needed.
- Regulatory approvals and net metering: C&I net metering applications are subject to state DISCOM approval, which can take anywhere from 2 weeks to a few months depending on the state and the system size. States with pro-solar regulatory frameworks like Gujarat, Karnataka, and Rajasthan process approvals faster. Maharashtra’s 2026 policy mandating battery storage for new C&I systems above 100 kW adds a new compliance layer for businesses in that state.
- O&M ((Operations and Maintenance)) and performance monitoring: A rooftop solar system for businesses is a 25-year asset. Its performance degrades slowly, typically 0.5-0.7% per year, but only if properly maintained. Dust and soiling are the largest performance reducers in Indian conditions, particularly in northern and western states.
Conclusion
C&I rooftop solar is not a speculative bet on future energy costs; it is a capital allocation decision with a measurable, contractible return. Most well-designed C&I solar projects in India today achieve payback within 3 to 6 years, after which they generate near-free electricity for another 20+ years.
With commercial tariffs rising structurally, a 40% Accelerated Depreciation benefit that front-loads tax savings, and financing models that eliminate upfront capital requirements, the business case for going solar has rarely been stronger.
The question is no longer whether solar makes financial sense for your business. It is whether you want to start capturing those savings this year or keep watching the electricity bill grow. With SolarSquare, you can start saving from today. Get your free consultation today!
Frequently Asked Questions
Can a business install solar without any upfront investment?
Yes. The RESCO or PPA model allows a third-party developer to install the system at zero cost to the business, which then purchases the generated electricity at a pre-agreed rate well below the grid tariff, typically ₹6-₹10/unit versus ₹6-₹15/unit from the DISCOM. Savings begin from month one with no capital outlay. Alternatively, solar loans covering 70-80% of project cost are available from banks and NBFCs, with EMIs typically offset by electricity savings from the start.
How much rooftop area does a 100 kW solar system require?
On average, 1 kW requires around 80 sq. ft. of shadow-free rooftop area. A 100 kW system therefore needs approximately 80,000 sq. ft. of usable, shadow-free roof space. The actual requirement can vary depending on panel efficiency and mounting configuration, as higher-efficiency panels generate the same output from less physical area.
Does net metering improve solar ROI for businesses?
Yes. Net metering allows businesses to export surplus solar generation to the grid during weekends, holidays, or low-consumption periods, earning credits against future electricity bills. Without net metering, any generation that exceeds real-time consumption is wasted. With net metering, 100% of generation has economic value, either as direct consumption savings or as exported credits. This is particularly important for businesses with variable operating schedules.
How long do commercial solar panels last?
Quality commercial solar panels carry performance warranties of 25 years, guaranteeing output at no less than 80-85% of rated capacity at the end of the warranty period. In practice, tier-1 panels routinely operate beyond 30 years with normal degradation when maintained well. The project life for rooftop solar installations is generally taken as 25 years for financial modelling, after which the system may continue generating power at slightly reduced rate. Inverters, which have a shorter lifespan of 10-15 years, represent the primary replacement cost over the system’s life.
What tax benefits are available for businesses installing solar?
Under Section 32 of the Income Tax Act, solar energy systems qualify for 40% Accelerated Depreciation in the first year, nearly three times the standard rate for plant and machinery. A company investing ~₹5 crore in a solar plant can claim ~₹2 crore in depreciation in Year 1 alone, reducing taxable income by ~₹2 crore.
At 25% tax, this is a ~₹50 lakh cash-flow benefit in the first year. GST Input Tax Credit on the system cost is also claimable by GST-registered businesses, making the effective cost of the installation lower than the invoice value.


 Previous Article
 22 min